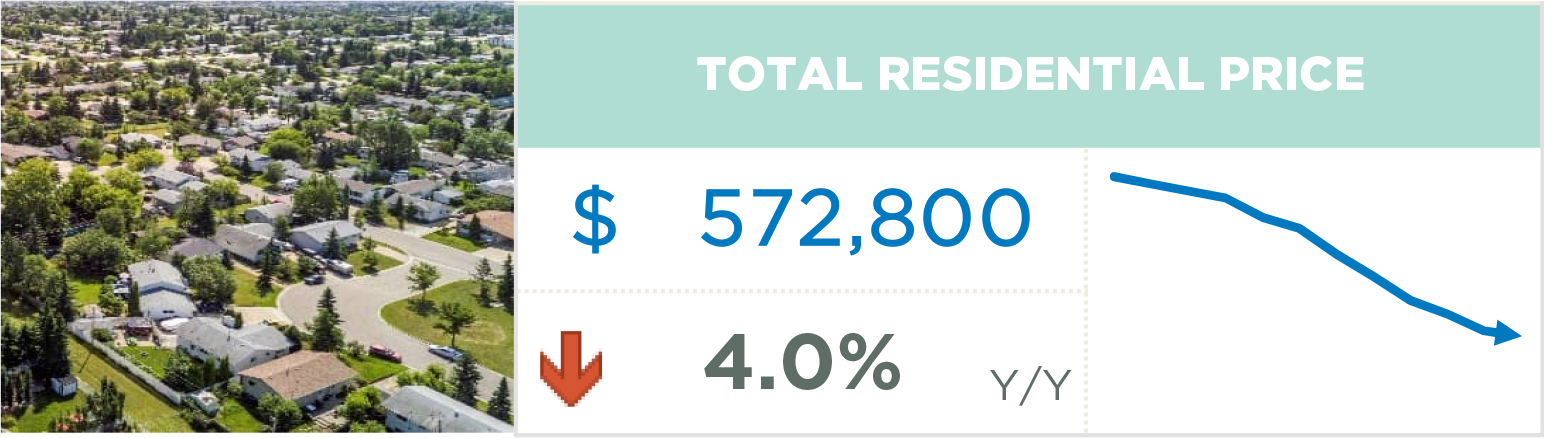
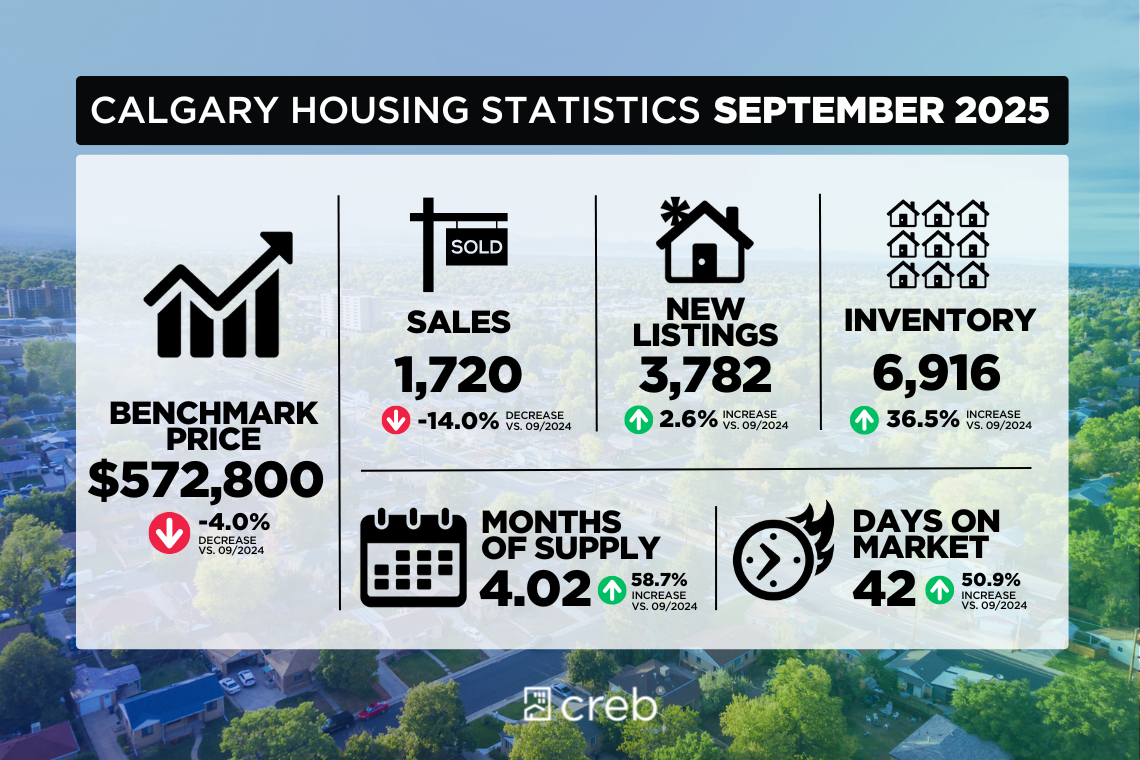
A boost in new listings drives further inventory gains and price adjustments.
The 1,720 sales in September were not high enough to offset the 3,782 new listings coming onto the market, driving further inventory gains as we move into the fall. There were 6,916 units in inventory in September, 36 percent higher than last year and over 17 percent higher than levels traditionally reported in September. Both row and apartment-style homes have reported the largest boost in supply compared to long-term trends.
“Supply levels have been rising in the resale, new home and rental markets. The additional supply choice is coming at a time when demand is slowing, mostly due to slower population growth and persistent uncertainty. Resale markets have more competition from new homes and additional supply in the rental market, reducing the sense of urgency amongst potential purchasers. Ultimately, the additional supply choice is weighing on home prices,” said Ann-Marie Lurie, CREB® Chief Economist.
Supply levels relative to demand typically drive shifts in home prices. In September, the sales-to-new-listings ratio dipped to 45 percent, and the months of supply pushed up to four months for the first time since early 2020. This is a higher level of supply compared to demand than is typically seen in the Calgary market, and should this persist, we could see a market that shifts more in favour of the buyer. However, conditions do vary by property type, price range and location.
Inventory gains for apartment-style homes over the past several months have contributed to buyer market conditions in this segment, driving year-over-year price adjustments of over 6 percent for a total benchmark price of $322,900 in September. While the detached segment has also seen a rise in the months of supply, it has not been as high as the apartment condo sector. At a benchmark price of $749,900, detached home prices are only 1 percent lower than last year, with most of the adjustments driven by the North East and North districts.
Housing Market Facts
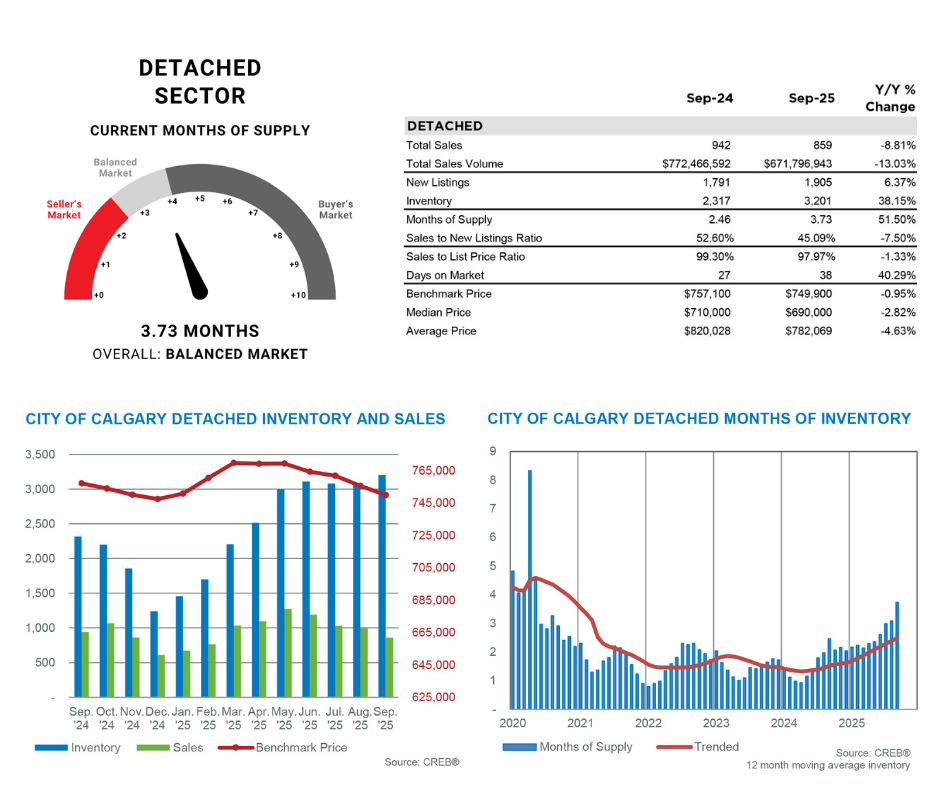
DETACHED
Sales in September slowed to 859 units, 9 percent lower than last year and below long-term trends for September. At the same time, new listings rose to 1,905 units, causing the sales-to-new-listings ratio to fall to 45 percent, levels not seen since 2018. While there has been an unexpected shift in September, it is too early to tell if this trend will continue as prior to this month the detached market has remained relatively balanced.
Improved supply choice is causing prices to decline relative to the record highs reported during the spring. As of September, the unadjusted benchmark price was $749,900, down nearly 1 percent from both last month and last year. While prices have eased from peak levels across all districts, the largest decline occurred in the North East and East district at over 6 percent. Despite recent adjustments on a year-to-date basis, prices remain nearly 2 percent higher than last year’s levels, with the City Centre reporting the highest gain at over 4 percent.
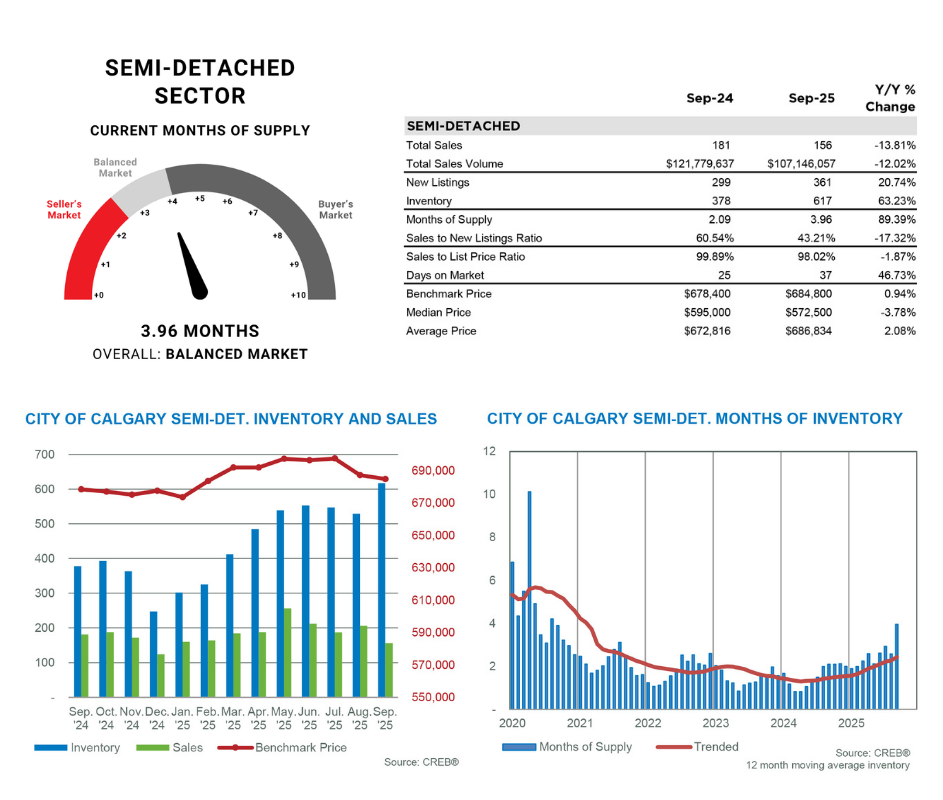
SEMI-DETACHED
New listings rose to 361 units in September, while sales fell to 156 units, causing the sales-to-new-listings ratio to drop to 43 percent. This also caused a rise in inventory levels and the months of supply pushed up to nearly four months. This is a significant shift compared to last month, where there was less than three months of supply.
Like the detached sector, it is too early to say if this trend will continue, but so far it has had minimal impact on home prices. As of September, semi-detached price was $684,800, slightly lower than last month and nearly 1 percent higher than last year. Year-to-date price growth has been the highest for semi-detached homes at over 3 percent, as this segment took longer to shift from a seller's market to one that was more balanced. Most of the price growth was driven by gains reported in the City Centre.
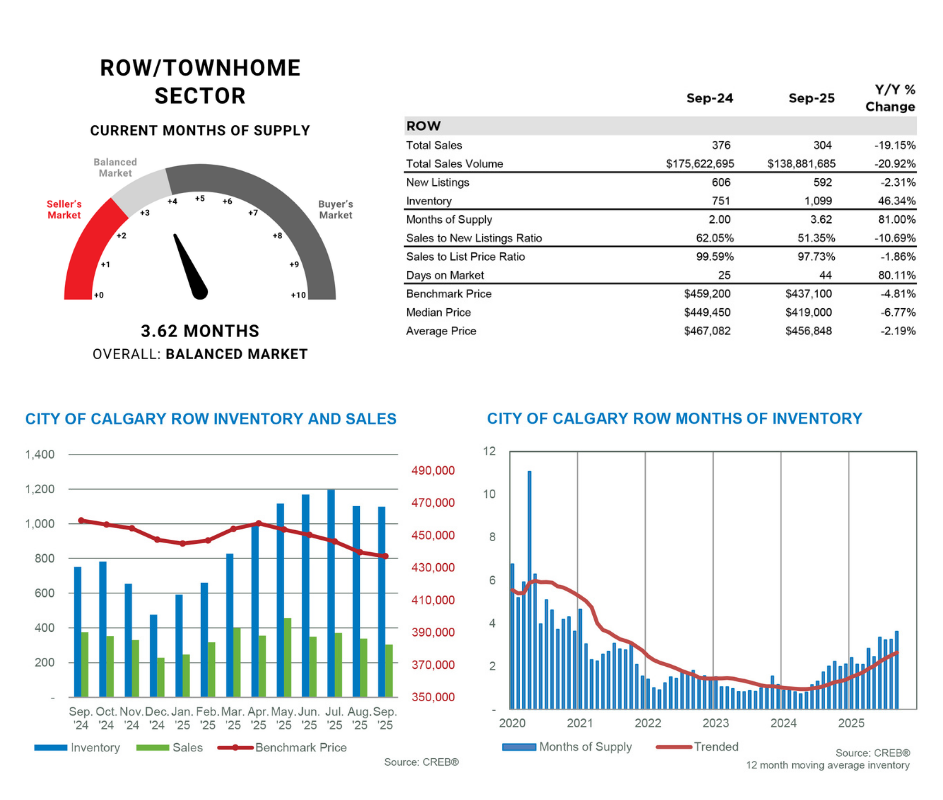
ROW/TOWNHOME
Following a pullback last month, new listings posted modest monthly gains. The 592 new listings were met with 304 sales, causing the sales-to-new-listings ratio to fall to 51 percent. This is not as low as the other property types and at these levels it was enough to prevent any further monthly gain in the already elevated inventory levels. September inventory levels were 1,099 units, the highest September level reported since 2018, and 30 percent higher than longer-term trends for the month. The largest gains in inventory occurred in the North East district, which also reported the highest months of supply and price decline compared to last year.
More supply choice has impacted resale prices, with the unadjusted benchmark price being $437,100. This is down less than 1 percent over last month and nearly 5 percent lower than last year’s prices. Year-to-date price adjustments have been much smaller at 1 percent, as declines in the North East, North and South East districts offset the gains reported in other parts of the city.
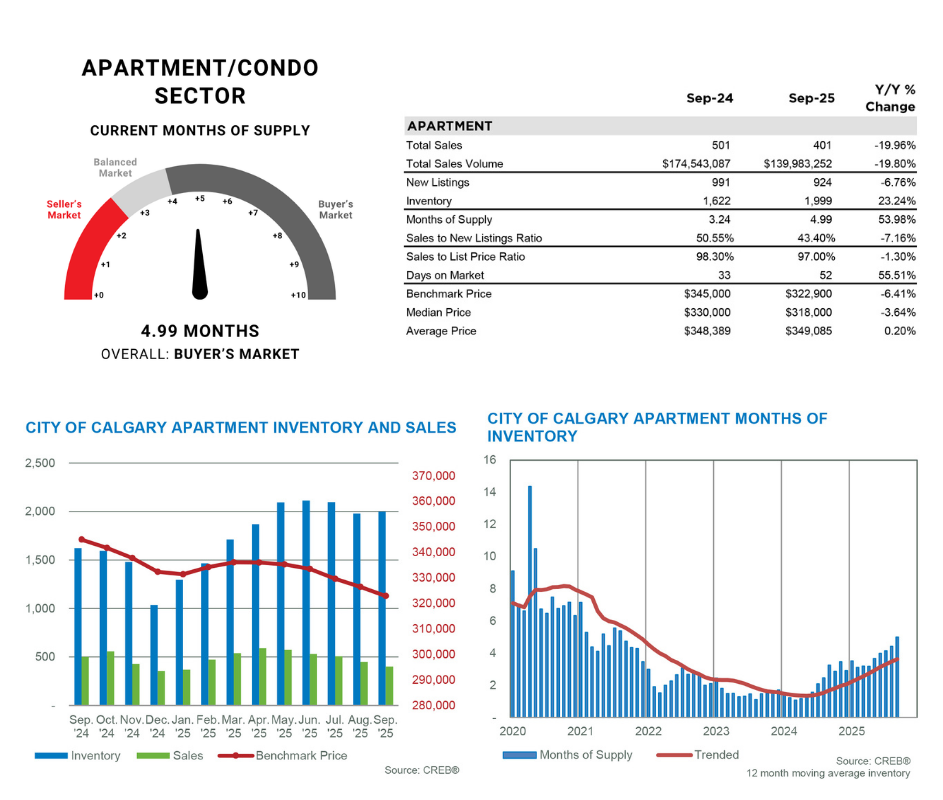
APARTMENT/CONDO
The most significant adjustment in the market occurred in the apartment condominium sector as improving rental supply, delayed adjustments in interest rates and improved selection for other property types has slowed apartment style demand from both first-time buyers and investors. September reported 401 sales and 924 new listings, dropping the sales-to-new-listings ratio to 43 percent and causing inventory to rise to 1,999 units.
The rise in supply caused the months of supply to push up to five months, the first time it has done that since 2021. As elevated levels of supply have persisted since June, prices have been trending down. As of September, the benchmark price was $322,900, down over 1 percent compared to last month and over 6 percent compared to last year. The year-to-date price adjustment has been just over 1 percent. Condo prices have slid across all districts compared to last September. The largest decline occurred in the North East district at over 10 percent, while the smallest decline occurred in the City Centre at 5 percent.