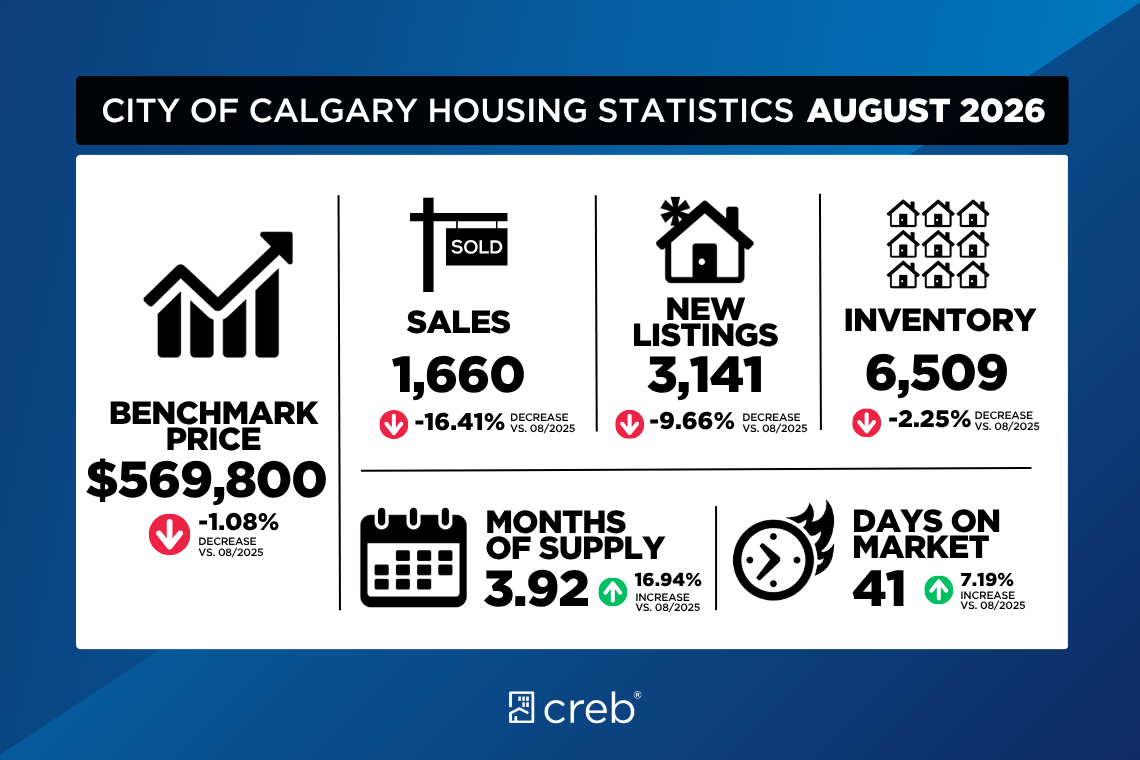
Consistent with trends throughout most of 2026, both sales activity and the number of new listings coming onto the market have continued to trend down compared with 2025 levels. In August, sales in Calgary were 1,660 units, down 16% compared with last year, while new listings fell by nearly 10% to 3,141 units.
The pullback in sales has not occurred across all price ranges, as homes priced over $1,000,000 have recorded gains over last year. These gains have mostly been driven by detached and semi-detached homes and are also consistent with where most of the supply growth has occurred.
“While sales growth in the upper end of the market was possible thanks to improved supply choice, it also reflects longer-term confidence in our market, as some buyers are not shying away from taking advantage of the available supply,” said Ann-Marie Lurie, Chief Economist at the Calgary Real Estate Board (CREB®). “Meanwhile, we have not seen the same pickup in activity in the lower price ranges, as favourable rental conditions are slowing the transition to ownership.”
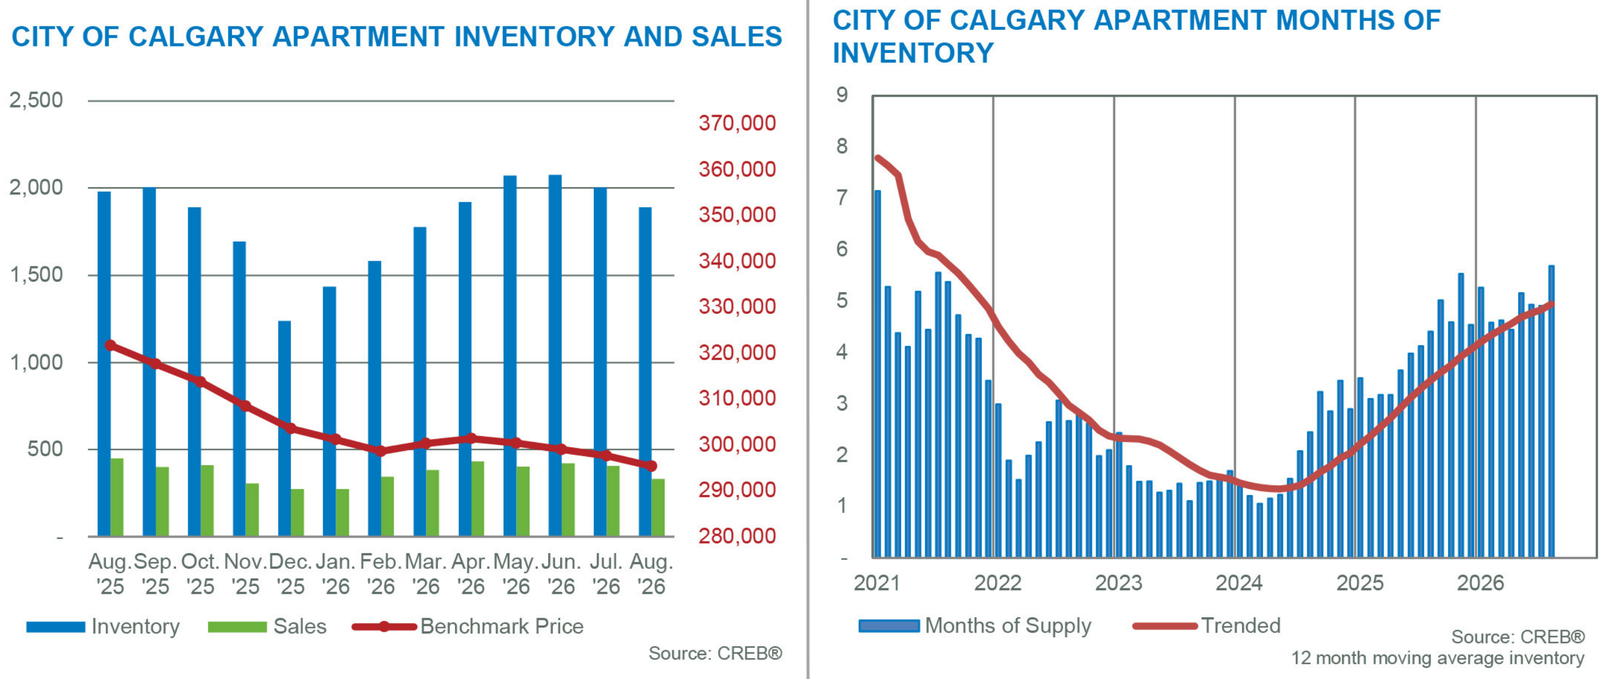
Inventory levels in August eased compared with the previous month and the same period last year, at 6,509 units. However, given the pullback in sales, the months of supply pushed up to nearly four months. Also consistent with trends throughout this year, conditions vary significantly by property type, with nearly six months of supply for apartment-style homes compared with over three months of supply for lower-density detached homes.
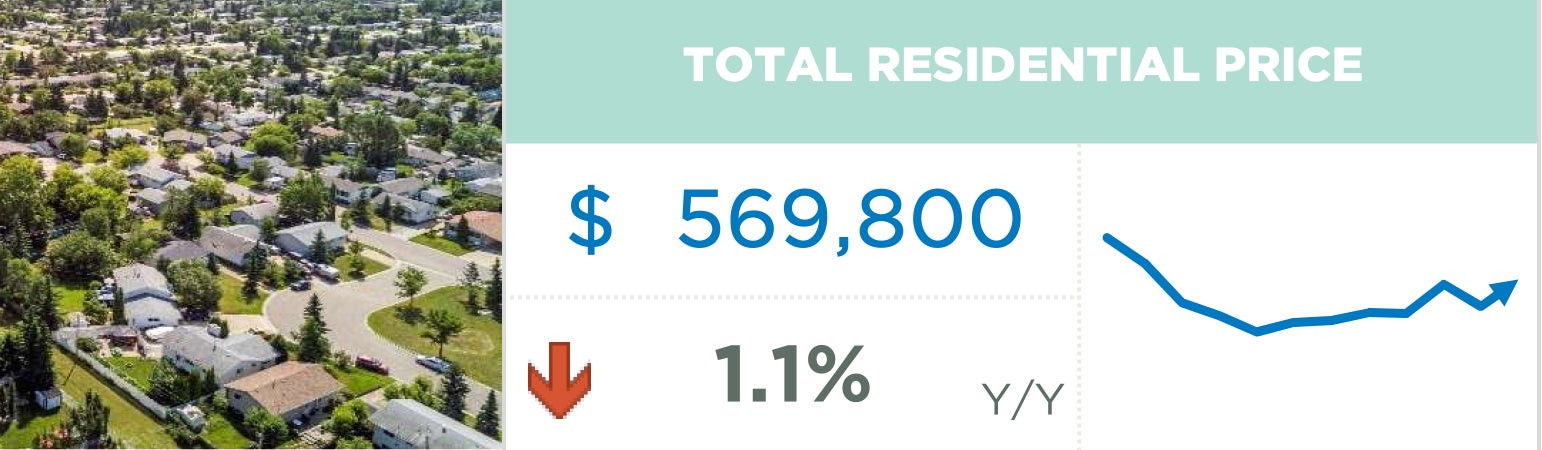
The relatively balanced conditions in the detached and semi-detached sector have prevented any significant shifts in prices compared with the steady price declines occurring in the oversupplied higher-density segments of the market. As of August, the total residential benchmark price was $569,800, similar to the previous month and 1% lower than 2025 levels.
Housing Market Facts
DETACHED
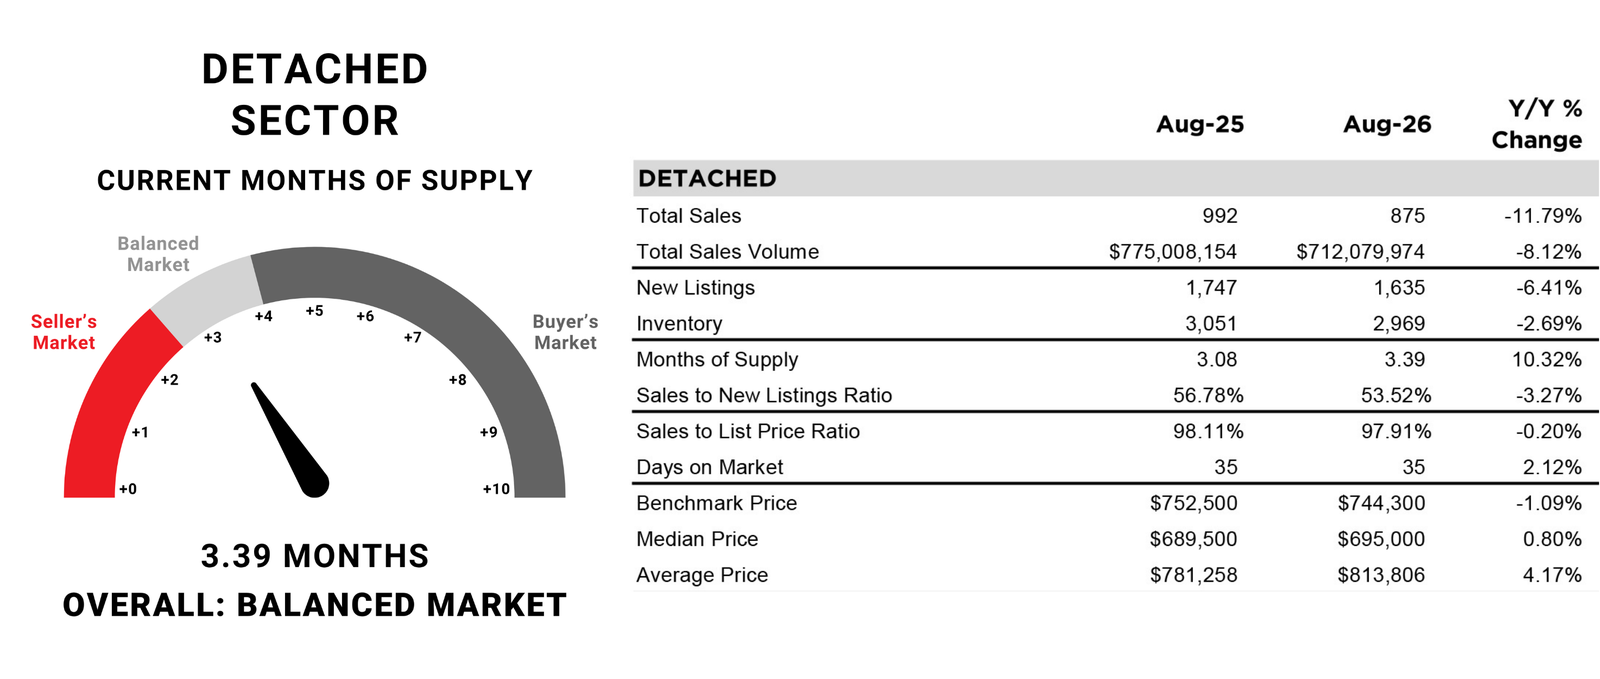
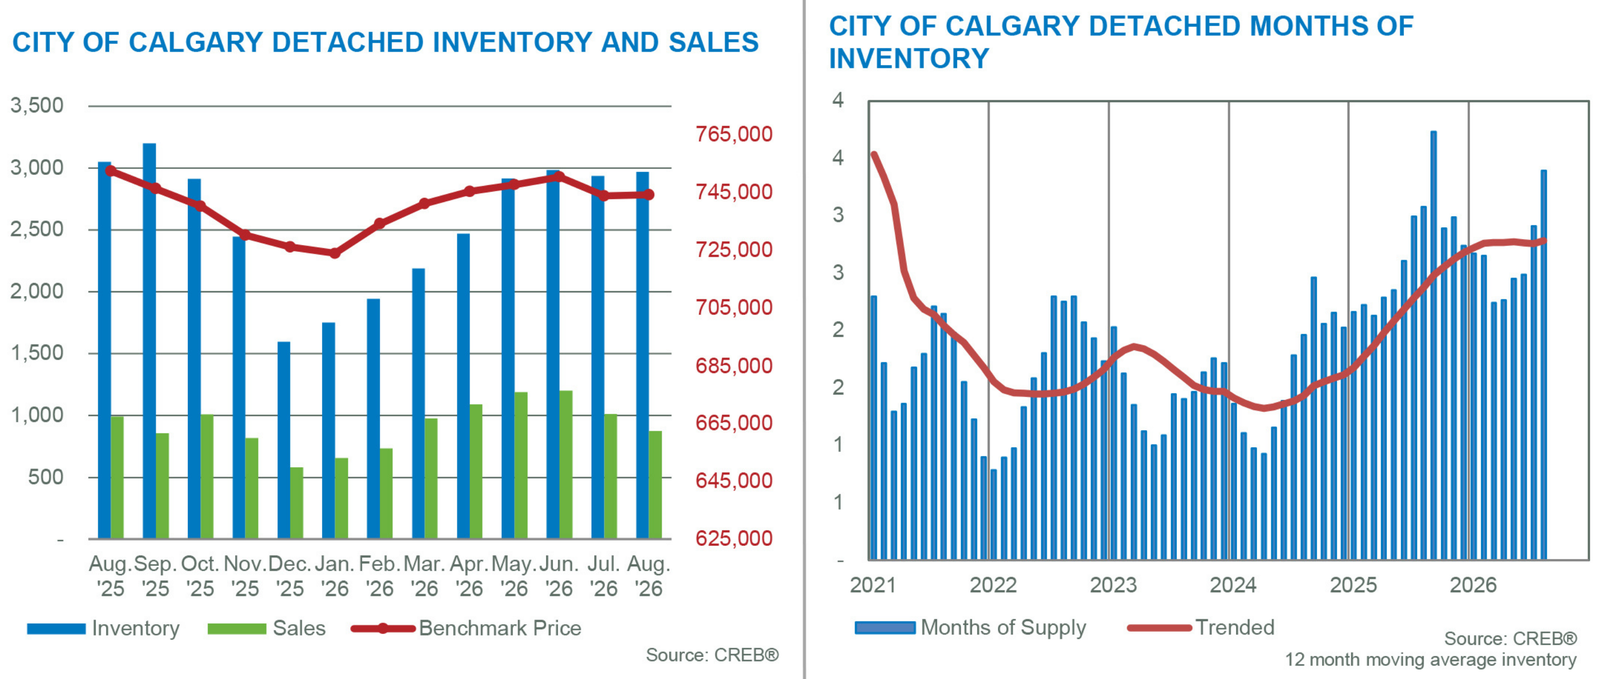
Gains in higher-priced sales were not enough to offset the pullbacks occurring for homes priced below $1,000,000, as sales fell by 12% to 875 units. At the same time, new listings trended down compared with both July and August 2025 levels, reaching 1,635 units. The steeper decline in sales compared with inventory levels was enough to support a modest monthly gain in inventory levels and drove up the months of supply to over three months. Market balance varies significantly based on price range and location. The months of supply remain below three months in the North West, West, South and South East districts, and above four months in the North and North East districts. The wide range of market balance is also reflected in pricing. Year-over-year gains of over 2% have occurred in the West and City Centre districts. Meanwhile, price declines were the steepest in the North East at over 6%. Overall, the benchmark price in August was $744,300, similar to July and down by 1% compared with last year.
SEMI-DETACHED
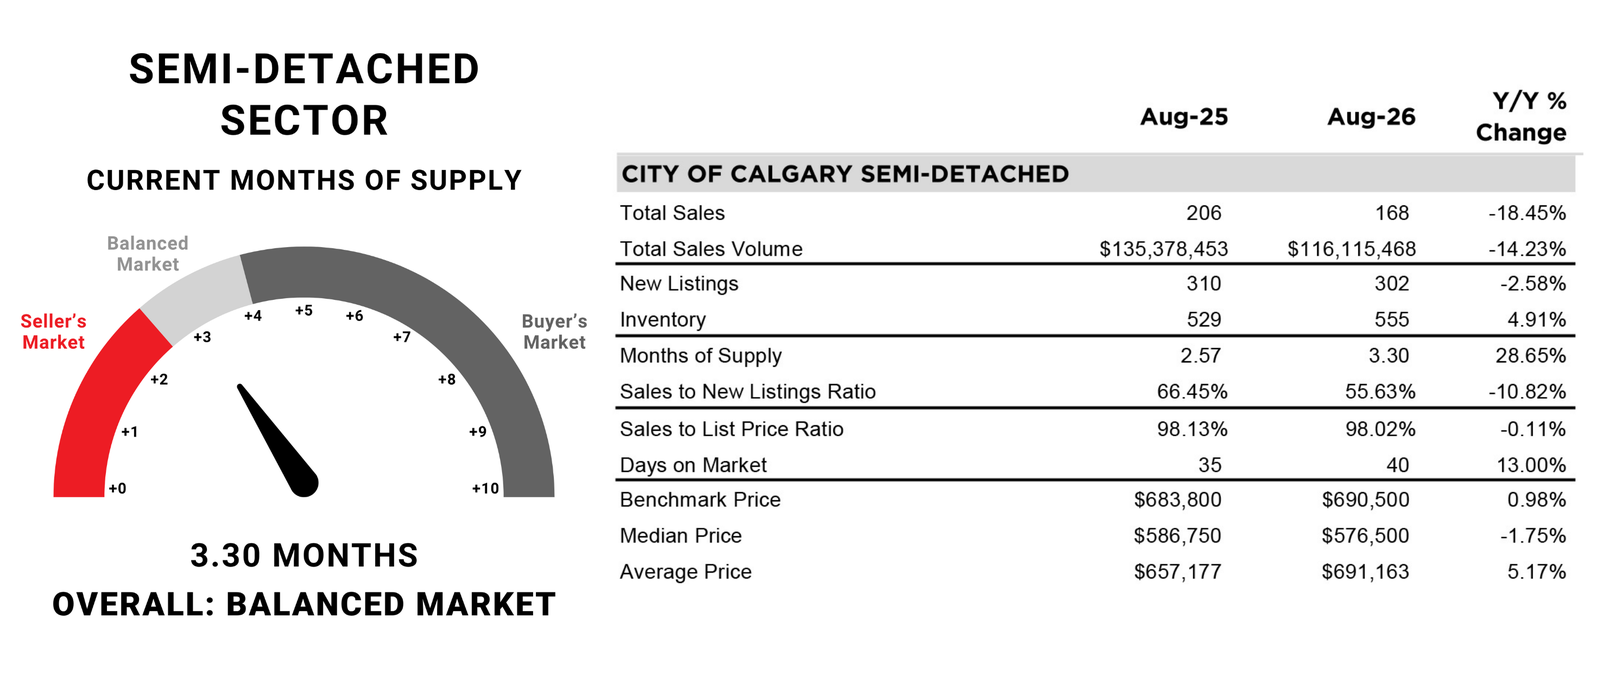
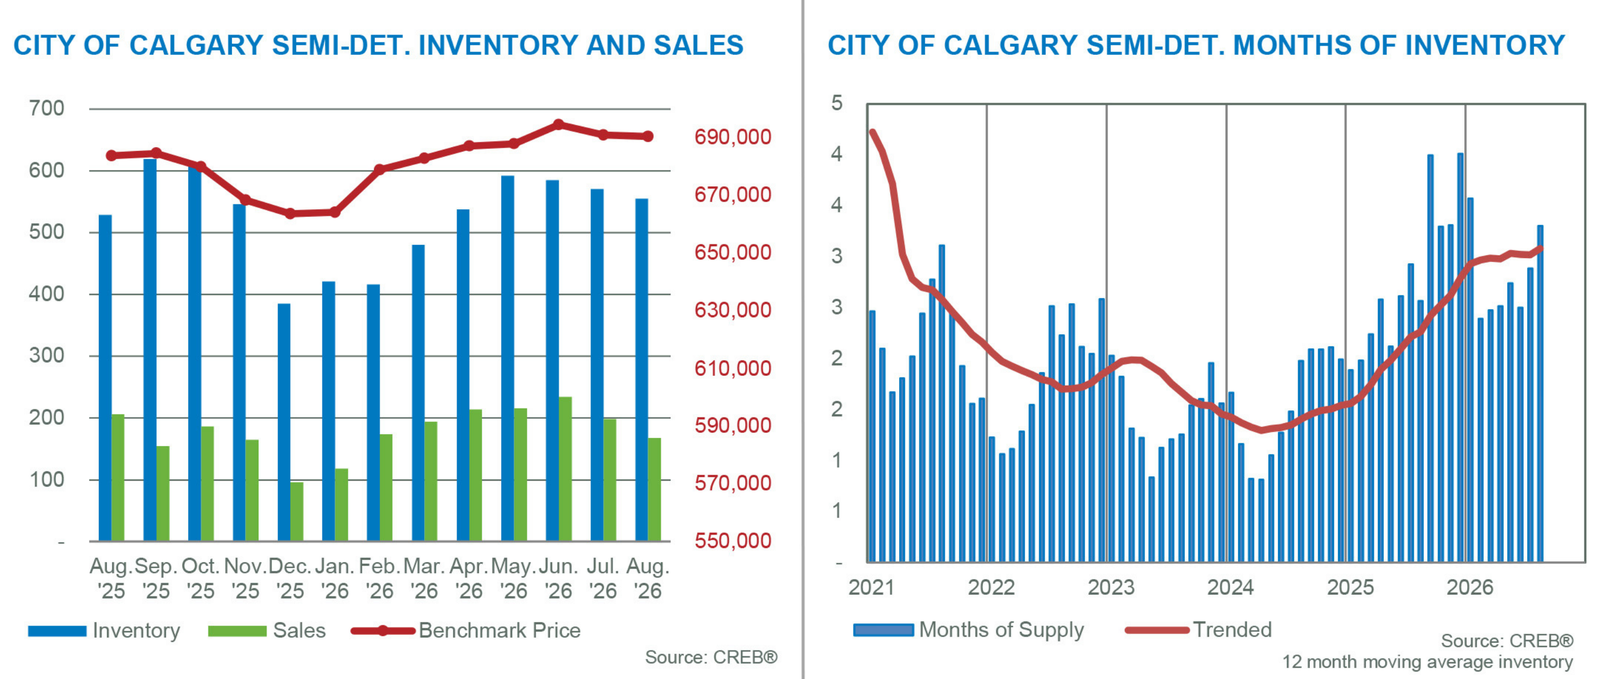
Easing sales in August were enough to push year-to-date sales down to 1,516 units, over 2% lower than last year’s levels. The easing of August sales was not matched by new listings, causing the sales-to-new-listings ratio to fall to 56%. While inventories eased slightly compared with the previous month, they remain nearly 5% higher than last year. The steeper monthly pullback in sales compared with inventories was enough to push the months of supply above three months, the first time this has happened since January. Despite the shift, conditions remain relatively balanced, and prices have been relatively stable. As of August, the unadjusted benchmark price was $690,500, similar to the previous month and nearly 1% higher than last year's levels. Price gains in the City Centre, North West and West districts offset pullbacks in other areas, contributing to the annual gain.
ROW/TOWNHOME
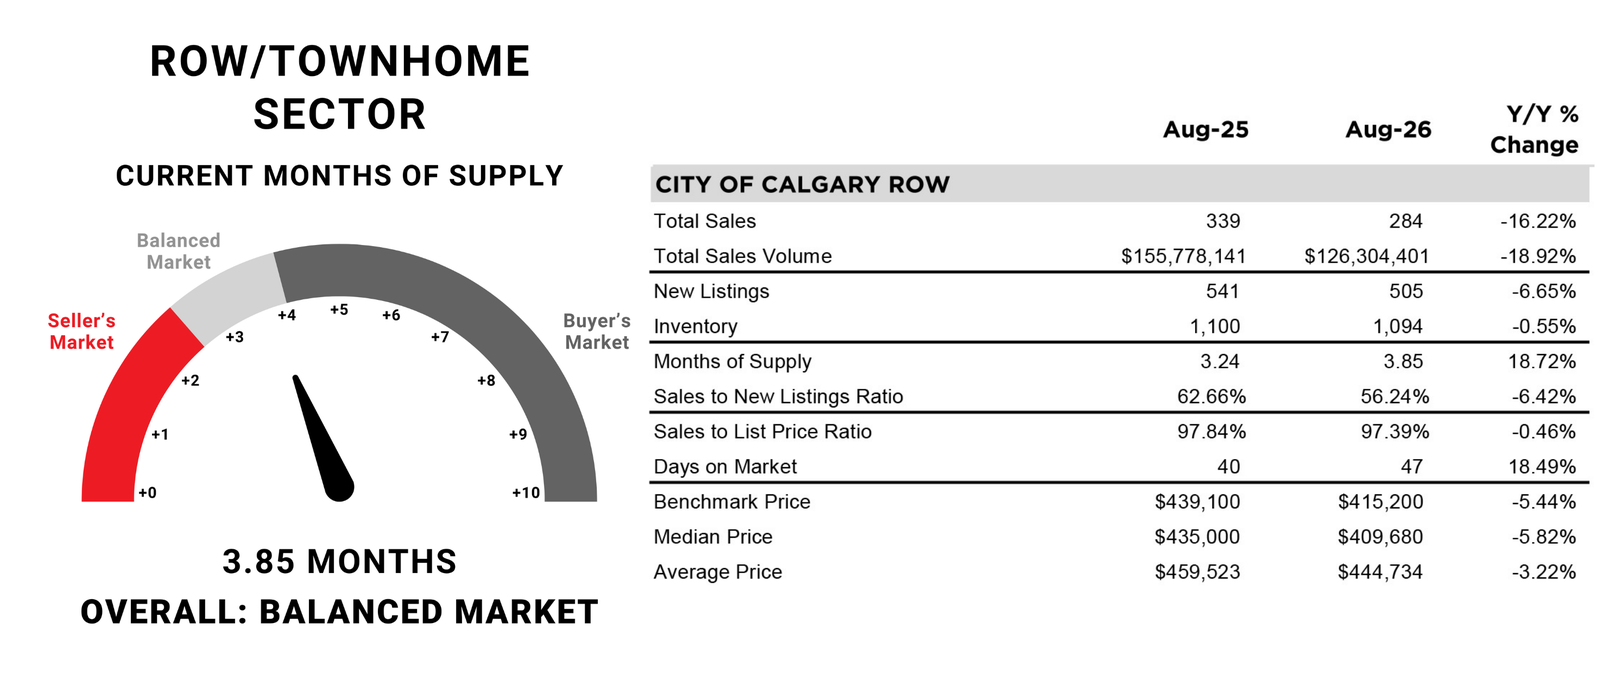
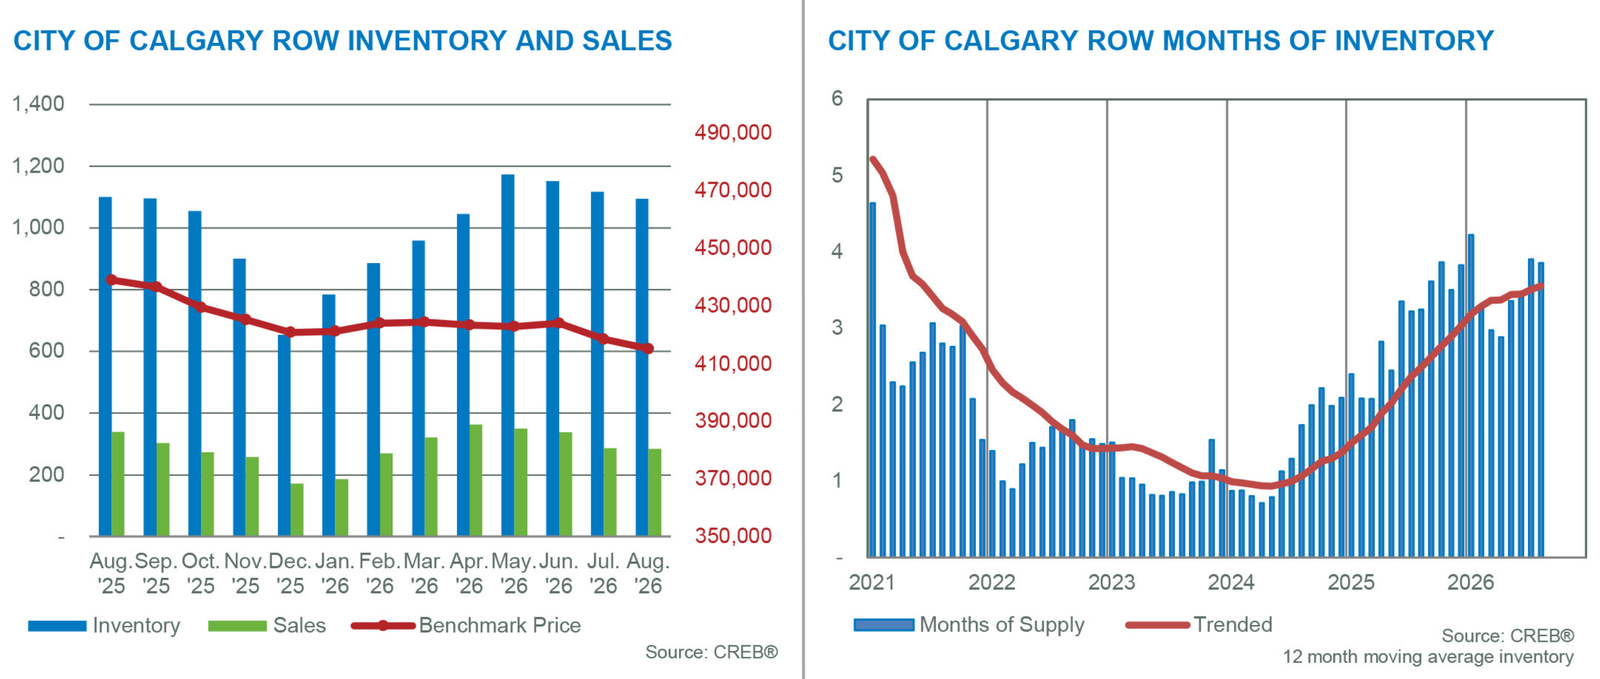
Sales continued to ease in August compared with last year, contributing to the year-to-date pullback of 15%. Additional new-home supply, along with more rental product availability, has contributed to some of the pullback in sales activity. Meanwhile, the pullback in new listings has helped prevent any further gains in inventory levels, and the months of supply remained near four months for the second month in a row. Like other sectors, conditions vary depending on location. The months of supply pushed above four months in the City Centre, North East and North districts, while remaining near three months in the West district. Prices have been easing across all districts in the city. The range of decline varied from over 12% in the North East to just over 1% in the North West district. As of August, the benchmark price was $415,200, down nearly 1% from July and 5% lower than levels reported last year at this time.
APARTMENT
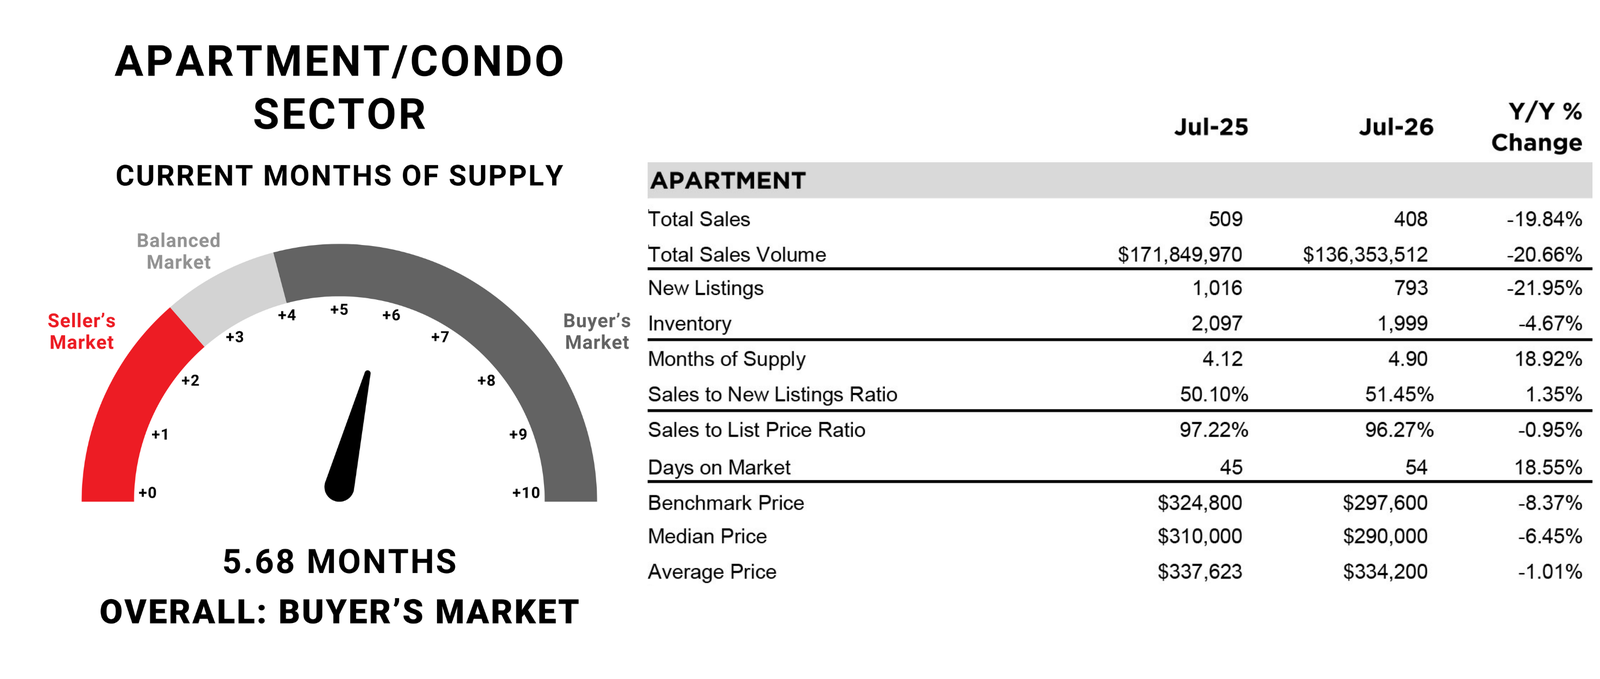
Apartment-style homes continue to face the most oversupply in the market, with nearly six months of resale supply. More rental supply is weighing on ownership demand from both first-time buyers and investors, which is slowing sales activity while supply levels remain elevated. In August, sales activity continued to fall, contributing to the year-to-date decline of 26%. New listings have also been declining enough to prevent any further inventory gain, but not enough to help the market shift away from buyer-market conditions. Persistently high supply levels relative to demand have weighed on apartment-style prices for the past two years. As of August, the unadjusted benchmark price was $295,400, nearly 1% lower than the previous month and 8% lower than 2025 levels. Prices peaked in August 2024 at $341,300 and currently sit nearly 13% lower than the peak price.